I was recently asked by one of my PhD supervisors to help out on a paper by doing some metagenomic analyses. My mission was essentially to perform some taxonomic analyses of metagenomes and show how a metagenome generated in our lab related to these. So, naturally, I said yes, carried out the necessary analyses and proceeded to design a figure to show the result. I figured a dendrogram would be a nice way of showing compositional similarity between the community we studied and other communities. First of all, I set about creating a distance matrix and plotting the dendrogram like so:
library(vegan)## Loading required package: permute## Loading required package: lattice## This is vegan 2.5-4data(dune) # load some dummy data
commDist <- vegdist(dune, "jaccard") # calculate the community similarity distance matrix
plot(hclust(commDist))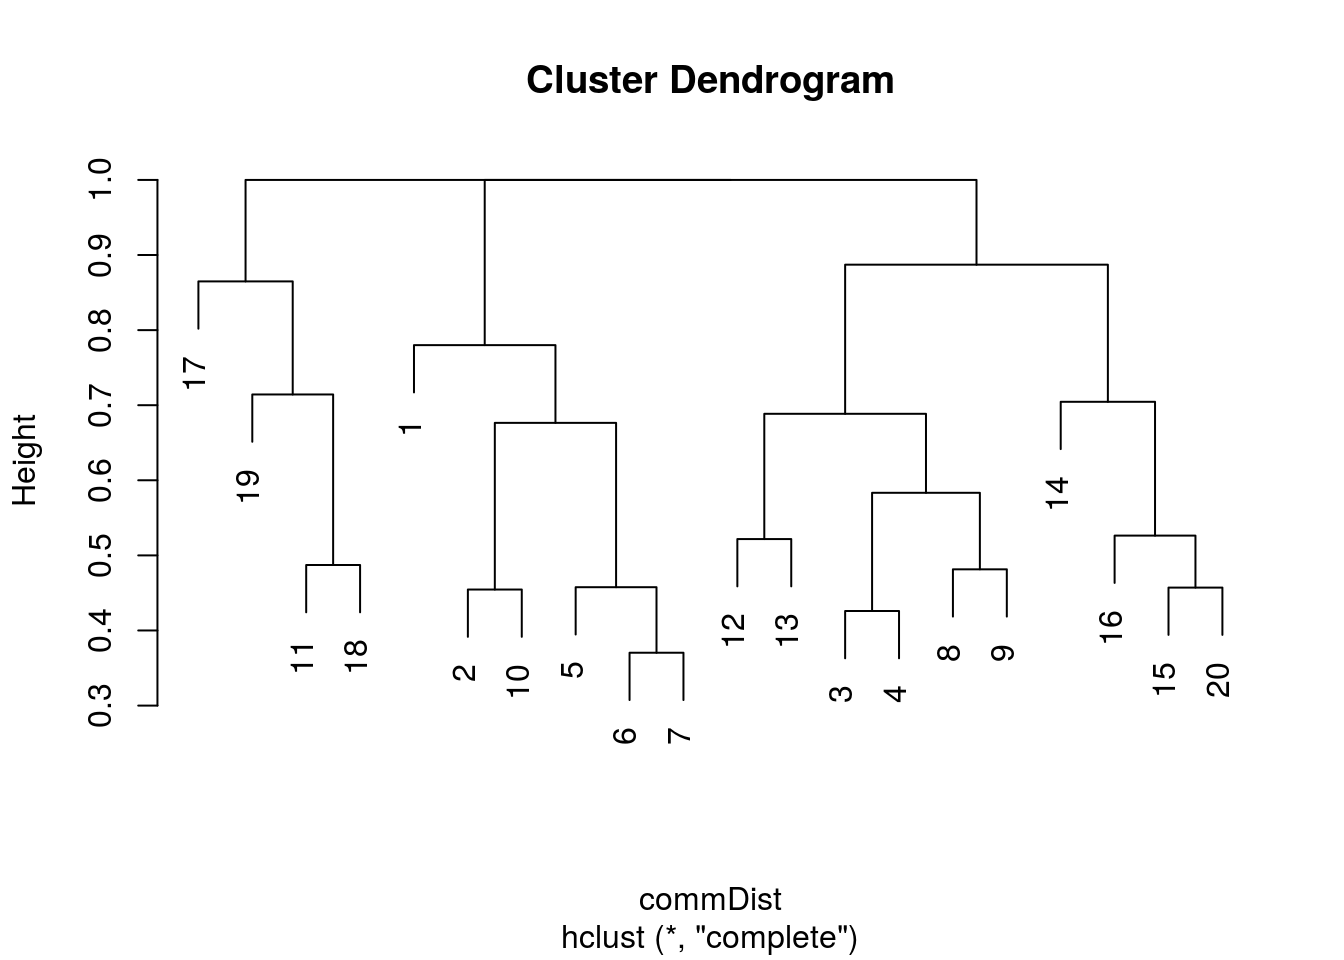
There you go. It’s easy to generate a basic dendrogram using any sort of distance matrix. So I then started tidying it up to make it a bit more presentable.
siteLabels <- paste("Sample ", rownames(dune), sep = "")  # create some sample labels
plot(hclust(commDist), labels = siteLabels, main = "", sub = "", xlab = "", ylab = "Jaccard Similarity", lwd = 2, cex = 1.2)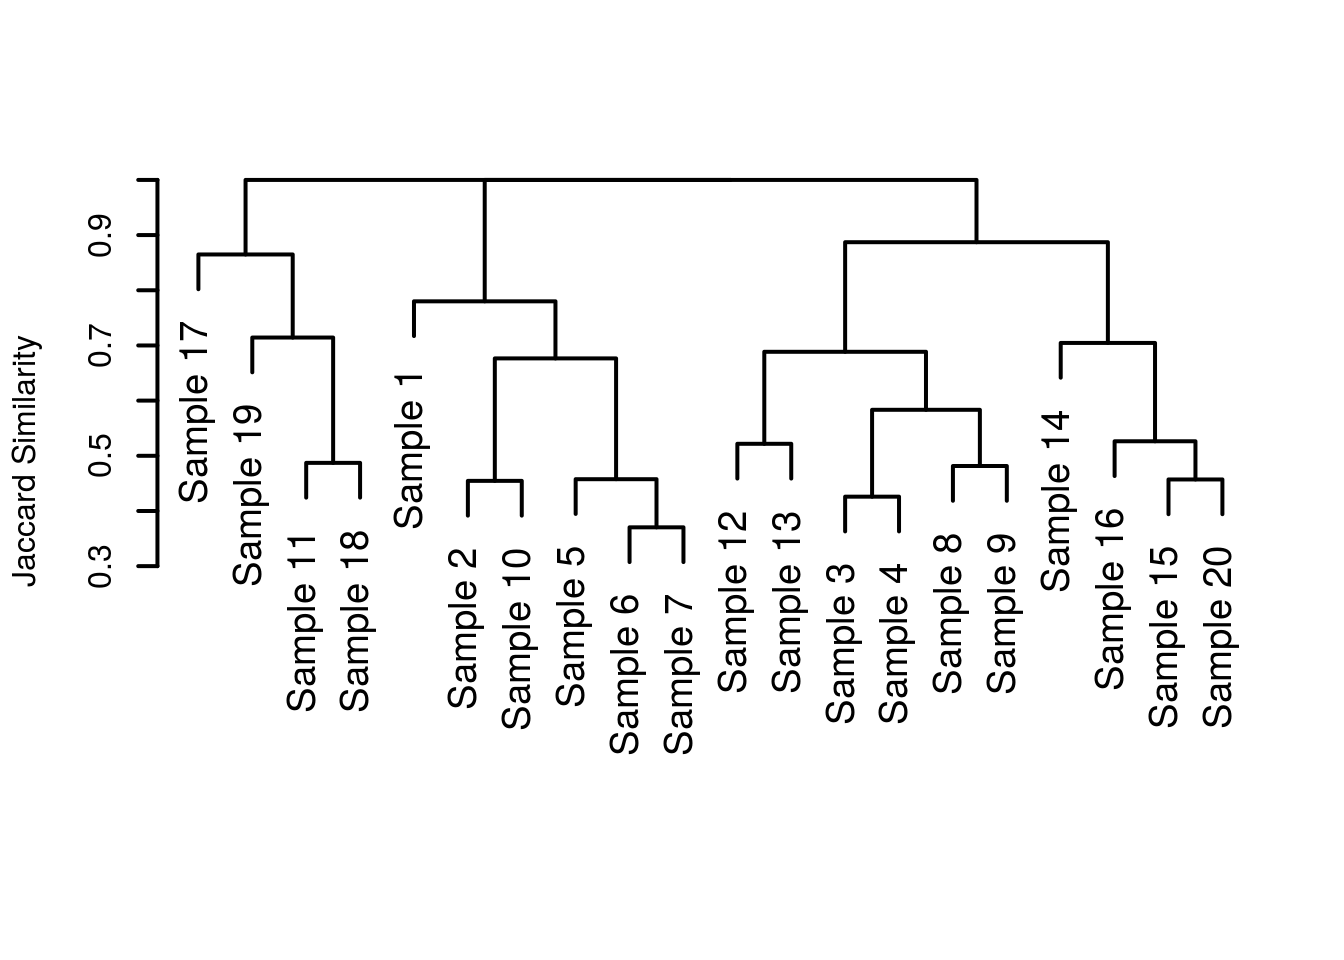
Much nicer! We’ve gotten rid of the nonsense at the bottom, given a more informative y axis label and generally made things ‘nicer’. Except, when I saw the first draft, I saw my supervisor had rotated the plot so that the leaf tips pointed to the left. For some reason this just looked wrong to my eyes and so I opted to replot the dendrogram, in a more sensible orientation.
Note that to do this, we have to change our approach slightly. For some stupid reason, when we want to plot a dendrogram horizontally, we have to coerce the hclust output to dendrogram class. Additionally, the ‘plot’ method for a dendrogram class object no longer accepts the labels parameter, so we must rename the rows of our dataframe and recalculate the distance matrix instead.
rownames(dune) <- siteLabels  # rename rows of dataframe with our sample labels created earlier

commDist <- vegdist(dune, "jaccard")  # recalculate the distance matrix so that it features our new sample names

par(mar = c(5, 1, 1, 5))  # adjust margins to make room for tip labels

# replot the dendrogram, note that we can now remove the "main =" and "sub =" arguments
# also remember to switch the x and y labels!
plot(as.dendrogram(hclust(commDist)), xlab = "Jaccard Similarity", lwd = 2, cex = 1.2, horiz = T)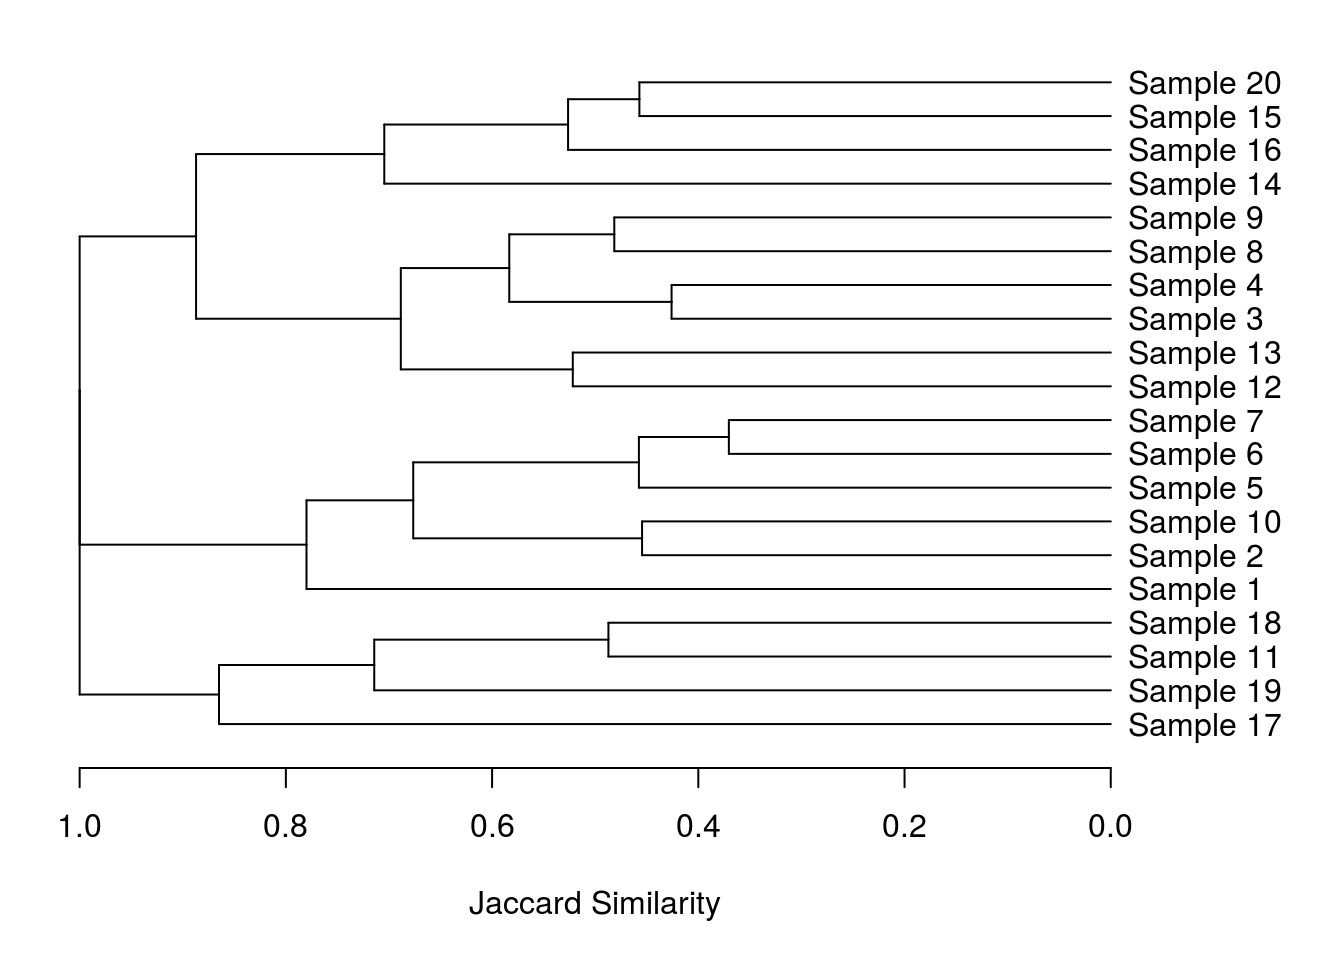
Perfect! Or at least I thought so. Turns out my supervisor liked the improved orientation but didn’t like the way the branches all ended at the same point. That should be easy to correct right? Wrong!
I spent near enough an entire day trying to get this plot perfect without success. I went as far as exploring the ggdendro package which allows plotting of dendrograms in a ggplot-esque manner.
Then I stumbled on a solution, enter dendextend! A quick peek of the package manual reveals some really awesome capabilities, I really urge you to take a look as some of the figures you can create are amazing. For my humble needs, this package solved all my problems easily, and in a couple of lines I’d created exactly the figure my supervisor wanted.
ifelse("dendextend" %in% rownames(installed.packages()) == T, library(dendextend), install.packages(dendextend))## Registered S3 methods overwritten by 'ggplot2':
## method from
## [.quosures rlang
## c.quosures rlang
## print.quosures rlang## Registered S3 method overwritten by 'dendextend':
## method from
## rev.hclust vegan##
## ---------------------
## Welcome to dendextend version 1.12.0
## Type citation('dendextend') for how to cite the package.
##
## Type browseVignettes(package = 'dendextend') for the package vignette.
## The github page is: https://github.com/talgalili/dendextend/
##
## Suggestions and bug-reports can be submitted at: https://github.com/talgalili/dendextend/issues
## Or contact: <tal.galili@gmail.com>
##
## To suppress this message use: suppressPackageStartupMessages(library(dendextend))
## ---------------------##
## Attaching package: 'dendextend'## The following object is masked from 'package:permute':
##
## shuffle## The following object is masked from 'package:stats':
##
## cutree## [1] "dendextend"# uncomment following line if this is the fist time you've installed this package!
# library(dendextend)
dend1 <- as.dendrogram(hclust(commDist))
wellHung <- hang.dendrogram(dend1) # the cheeky variable names are absolutely essential!
plot_horiz.dendrogram(wellHung, side = F, xlab = "Jaccard Dissimilarity")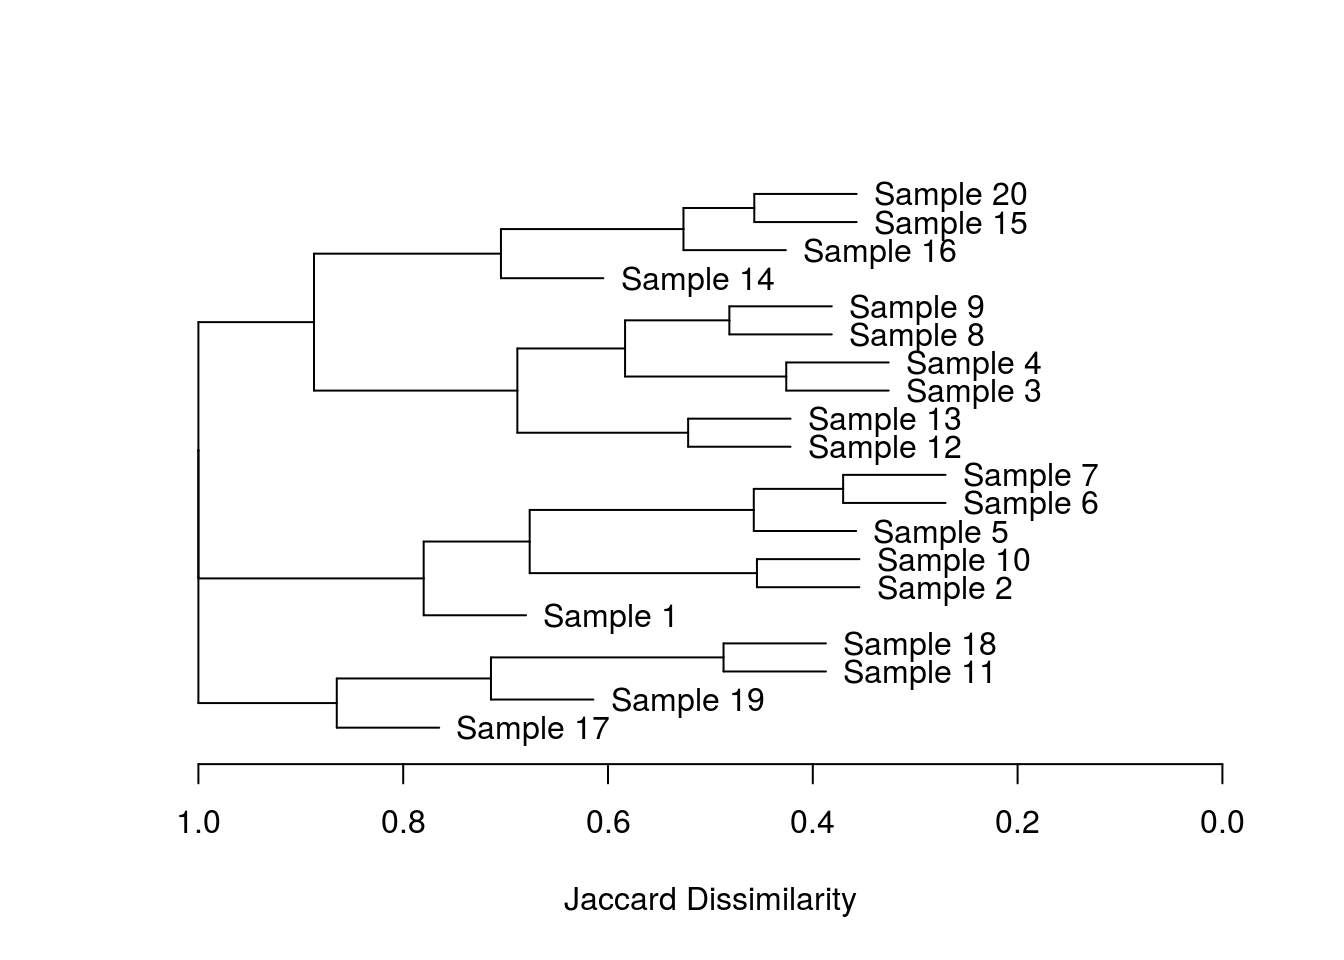
There you go, an awesome package which save me from wasting too many more days of work!